What Is HPLC Purity in Peptide Testing?
What Is HPLC Purity in Peptide Testing?
RESEARCH USE ONLY
This guide explains analytical interpretation of HPLC data for laboratory research materials. It does not provide dosing, administration, reconstitution, treatment or veterinary-use guidance.
What does HPLC purity mean?
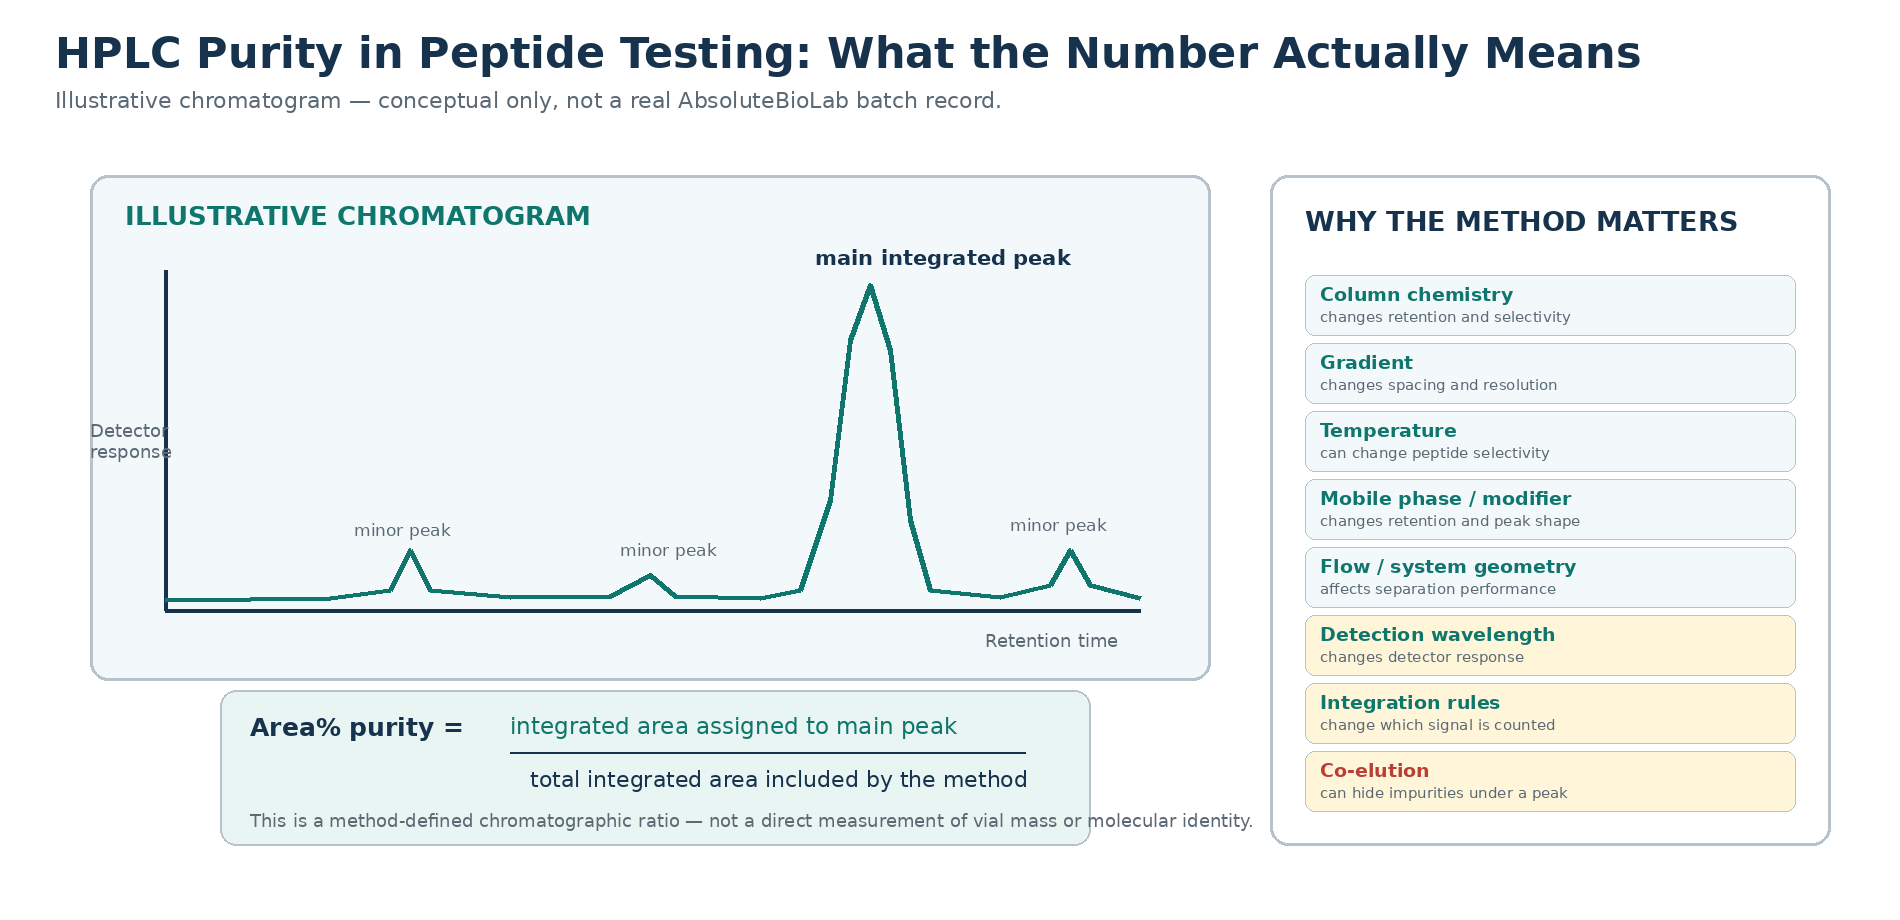
In peptide testing, an HPLC purity value is usually a chromatographic area percentage produced under a defined liquid-chromatography method. The sample is separated on a chromatographic column, the detector records signal as components elute, and the integrated area assigned to the main peptide peak is compared with the total integrated area included by the method.
A result such as 98.5% area therefore means that the main integrated peak contributed 98.5% of the included detector area in that particular run. It does not, by itself, mean that 98.5% of the powder in the vial is peptide by mass, that the main peak has the correct molecular identity, or that every possible impurity was detected.
How reverse-phase HPLC separates peptides
Reversed-phase HPLC (RP-HPLC) is widely used for synthetic-peptide separation and impurity profiling. A peptide mixture is introduced to a hydrophobic stationary phase, commonly a reversed-phase bonded column, and eluted with a changing mobile-phase composition. Components that interact differently with the stationary phase separate in time and appear as chromatographic peaks.
The exact separation is not an intrinsic property of the peptide alone. Column chemistry and geometry, gradient steepness, mobile-phase composition and modifier, flow rate, temperature, sample solvent and other method parameters can alter retention and resolution. Experimental studies of peptide/protein mixtures have shown that temperature and gradient steepness can materially change band spacing and selectivity.[3] More recent systematic peptide work likewise found that gradient, flow, temperature and modifier choices affect separation performance and method transferability.[5]
How area-percent purity is calculated
In a simple area-normalisation approach, the integrated detector area assigned to the main peak is divided by the total integrated detector area included in the calculation and expressed as a percentage:
Chromatographic area % = main-peak integrated area / total included integrated area x 100
The important phrase is ‘included integrated area’. The result depends on what the chromatographic method resolves and what the data-processing method integrates. An unresolved impurity that co-elutes beneath the main peak may be counted with the main peak. Conversely, a signal below a reporting or integration threshold may be excluded. Baseline placement, peak splitting, integration start/stop points and treatment of solvent-front or system peaks can therefore change the reported area percentage.
| HPLC output | What it can tell you | What it does not prove |
|---|---|---|
| Main-peak area % | The fraction of included detector signal assigned to the main chromatographic peak under that method. | Exact peptide mass fraction in the vial. |
| Retention time | Where a component eluted in that particular method. | Molecular identity by itself. |
| Peak pattern | Whether the method resolved additional detected components. | That no co-eluting or undetected impurity is present. |
| Peak shape / resolution | Whether the separation appears suitable for integration and whether neighbouring signals are resolved. | The chemical structure of each peak. |
| Chromatogram + integration table | More context for how the reported area value was obtained. | Sterility, endotoxin, biological activity or long-term stability. |
Why HPLC purity is not the same as molecular identity
Chromatographic purity and molecular identity are separate analytical questions. A dominant HPLC peak can be highly pure chromatographically and still represent the wrong compound if the identity of that peak has not been established.
ICH Q6A makes the same analytical distinction in its pharmaceutical context: identification solely by a single chromatographic retention time is not regarded as sufficiently specific, whereas orthogonal or combined approaches such as HPLC/MS can provide stronger identification evidence.[2] That guidance is not a regulatory standard for an RUO supplier; it is useful here because the analytical principle is general.
Identity guide: What Is Mass Spectrometry in Peptide Identity Testing?
Combined document interpretation: How to Read a Peptide Certificate of Analysis
Why detector wavelength changes the result you see
UV detection is common in peptide RP-HPLC, but wavelength matters because detector response depends on molecular absorbance. Around 214 nm, peptide-bond absorbance contributes strongly to signal, which is why this region is widely used for peptide detection. Primary measurements by Kuipers and Gruppen quantified peptide-bond and amino-acid contributions at 214 nm and showed that aromatic residues can contribute substantially different absorbance from the peptide bond itself.[4]
This creates an important interpretation limit: even at 214 nm, peak area is not guaranteed to be directly proportional to molar amount across chemically different impurities. At longer wavelengths, the bias can be greater because detection increasingly depends on particular chromophores such as aromatic residues. A wavelength may be useful for a specific method, but the reported area percentage must be interpreted as the output of that defined detector method rather than as an absolute composition measurement.
Therefore, this article does not set a universal rule that every peptide analysis must use one particular wavelength. The appropriate detection strategy belongs to the validated or fit-for-purpose analytical procedure for the material being tested.
Why two laboratories can report different HPLC purity values
Different results do not automatically mean that one laboratory is wrong. If two laboratories use different methods, they may separate or detect components differently. ICH Q2(R2) and Q14 emphasise that analytical procedures are developed and validated for an intended analytical purpose, with performance characteristics and method parameters that need to be understood.[1]
For supplier comparison, a headline ‘99%’ versus ‘98%’ number is therefore less informative than a transparent method plus chromatogram, integration context and orthogonal identity evidence.
| Method variable | Possible effect on purity result | What to compare before judging the numbers |
|---|---|---|
| Column / stationary phase | Changes selectivity and which impurities resolve from the main peak. | Column chemistry, dimensions, particle properties and method suitability. |
| Gradient profile | Changes retention spacing and resolution. | Start/end composition, gradient slope and run time. |
| Temperature | Can alter peptide retention and selectivity. | Column temperature and whether it is controlled. |
| Mobile phase / modifier | Changes retention, ionisation state, peak shape and selectivity. | Solvent composition, acid/modifier and pH where applicable. |
| Flow / system volume | Can alter efficiency and method transfer. | Flow rate, instrument dwell volume and column dimensions. |
| Detection wavelength | Changes which components contribute strongly to detector signal. | Detector type, wavelength and whether multiple wavelengths are monitored. |
| Integration / reporting rules | Changes which peaks or shoulders are counted in the total area. | Baseline rules, thresholds, manual integration and excluded regions. |
Can a chromatogram prove a peptide is ‘high purity’?
A chromatogram can support a chromatographic-purity claim when the method resolves the relevant components and the integration is transparent. It cannot prove more than the method measured.
- A large main peak is not identity proof unless the main peak is independently assigned.
- A clean-looking trace can hide co-eluting impurities if the method does not resolve them.
- A cropped or truncated run can omit relevant regions of the chromatogram.
- Unlabelled axes, missing method details or missing sample/batch identifiers reduce interpretability.
- Manual integration is not automatically invalid, but unexplained integration changes deserve scrutiny because they can alter area percentages.
Detailed chromatogram scrutiny: Peptide Chromatogram Red Flags and Purity-Claim Limitations
Is there a universal ‘research-grade’ HPLC purity threshold?
No single HPLC area-percentage threshold is scientifically appropriate for every peptide, impurity profile and experiment. A specification is meaningful only when it is tied to the product, analytical procedure, impurity risks and intended laboratory use.
The current live version of this guide describes >=98% as a universal research standard. That framing should be removed. A 98% area result under one method is not automatically superior to a 97% result under a more resolving or differently selective method, and a high area percentage does not identify what the remaining peaks are. Conversely, a lower area percentage may be unacceptable for a particular method if a specific impurity is known to interfere with the experiment. The laboratory should define acceptance criteria that are relevant to its research and use the batch-specific evidence supplied for the material.
HPLC purity is also not peptide content by mass
Area-percent purity describes detector signal after chromatographic separation. It does not directly measure how much of the weighed material is peptide. Water, counter-ions and other non-peptide mass can be present without appearing in the peptide UV area calculation, and detector response can differ between components.
If exact peptide content or mass fraction is critical, use a quantitative method designed for that purpose rather than multiplying the vial mass by the HPLC area percentage. The analytical requirement depends on the research question and the material.
Counter-ion context: Residual TFA, Counter-Ions and Peptide Desalting
What should be visible when evaluating an HPLC purity claim?
Not every Certificate of Analysis will display every method parameter on the face of the document. The key question is whether enough batch-specific evidence is available to understand what the reported purity value represents and whether it is fit for the laboratory’s decision.
| Minimum context | Why it matters |
|---|---|
| Product / exact entity and batch | Links the chromatogram and result to the material being evaluated. |
| Chromatographic method summary | Shows how separation was achieved and whether results from another method are comparable. |
| Column / stationary phase | Affects selectivity and resolution. |
| Mobile phases / modifier and gradient | Affect retention, peak shape and separation. |
| Detection method and wavelength | Defines which detector signal is being integrated. |
| Chromatogram with labelled axes | Allows the reviewer to inspect retention region, baseline and resolved peaks. |
| Integration / area table | Shows how the headline percentage was calculated. |
| Orthogonal identity evidence where relevant | Helps establish that the main chromatographic peak corresponds to the intended peptide. |
Frequently asked questions
Does 99% HPLC purity mean the vial is 99% peptide by weight?
No. HPLC area percentage is a chromatographic detector ratio. It does not directly measure total peptide mass fraction and generally does not include water, counter-ions or other components that are not represented in the integrated peptide signal.
Can HPLC confirm that the main peak is the correct peptide?
Not by retention time alone. Molecular identity needs more specific or orthogonal evidence, commonly mass-spectrometric evidence in peptide analysis.
Is 214 nm always the correct wavelength for peptide purity?
214 nm is widely used because peptide bonds absorb strongly in that region, but this guide does not prescribe a universal wavelength. Detection should be fit for the material and method, and area percentages should be interpreted in that method context.
Why can two HPLC reports for the same peptide show different purity values?
Different columns, gradients, temperatures, mobile phases, detector settings and integration rules can resolve and count components differently. Compare the methods before comparing the headline percentages.
Can an impurity hide underneath the main HPLC peak?
Yes. If two components co-elute under the selected chromatographic conditions, their detector signal can be integrated together. Better separation or orthogonal detection may be required to reveal the impurity.
Is >=98% the universal standard for research peptides?
No. A useful acceptance criterion must be product-, method- and experiment-specific. A universal area-percentage threshold should not replace batch-specific analytical review.
Key takeaway
HPLC purity is best read as a method-defined chromatographic area percentage. It is powerful evidence about the detected impurity profile when the separation and integration are appropriate, but it is not molecular identity, peptide content by mass or a universal quality guarantee. When reviewing a purity claim, look beyond the headline number to the batch, chromatogram, method, detector settings, integration and orthogonal identity evidence.
References
- ICH Q2(R2). Validation of Analytical Procedures. Final guidance, March 2024. Used for general principles of fit-for-purpose analytical procedure validation; not presented as a regulatory requirement for Core Research RUO materials.
- ICH Q6A. Specifications: Test Procedures and Acceptance Criteria for New Drug Substances and New Drug Products: Chemical Substances. Used for the analytical distinction between chromatographic retention and specific identification; not presented as an RUO regulatory requirement.
- Chloupek RC, Hancock WS, Marchylo BA, Kirkland JJ, Boyes BE, Snyder LR. Temperature as a variable in reversed-phase high-performance liquid chromatographic separations of peptide and protein samples. II. Selectivity effects observed in the separation of several peptide and protein mixtures. Journal of Chromatography A. 1994;686(1):45-59. DOI: 10.1016/S0021-9673(94)89009-9.
- Kuipers BJH, Gruppen H. Prediction of Molar Extinction Coefficients of Proteins and Peptides Using UV Absorption of the Constituent Amino Acids at 214 nm To Enable Quantitative Reverse Phase High-Performance Liquid Chromatography-Mass Spectrometry Analysis. Journal of Agricultural and Food Chemistry. 2007;55(14):5445-5451. DOI: 10.1021/jf070337l.
- Streuli A, Erckes V, Nardone B, Bedard V, Beland F, Steuer C. Improvement of Analysis and Transferability in Peptide Purification: From HPLC to FPLC and Back Again. Journal of Peptide Science. 2026;32(3):e70090. DOI: 10.1002/psc.70090.